
Every future energy plan begins with a guess about demand. It may be called a load forecast, an electrification scenario, a peak-demand projection, a planning case, or a sensitivity. The name sounds technical and quiet, but the forecast decides how much generation planners think they need, which substations look overloaded, whether a transmission line appears urgent, how much storage is useful, and whether a large new customer looks manageable or disruptive.
A load forecast is not simply a population chart with a power number attached. Electricity demand has shape. It rises and falls by hour, season, weather, local economy, building stock, equipment choices, industrial production, charging behavior, and the habits of millions of devices. It is affected by heat waves, cold snaps, cloud cover, school calendars, factory shifts, water systems, data-center training runs, and the slow replacement of furnaces, boilers, cars, and appliances. The electric grid basics guide explains that supply and demand must stay balanced in real time. Load forecasting is the attempt to see tomorrow’s balancing problem before the control room has to solve it.
The forecast matters because power infrastructure is slow. A customer can buy new equipment in months. A building owner can install heat pumps over a renovation cycle. A data-center developer can reserve land and interconnection capacity before the surrounding grid is ready. A transformer, substation, transmission upgrade, or firm capacity resource may take much longer. If demand growth is underestimated, the grid can become a bottleneck just when electrification, computing, or industrial expansion accelerates. If demand growth is exaggerated, customers may pay for assets that sit underused, and public trust can erode because the plan looked inflated.
Demand Is Not One Curve
The simplest forecast is annual energy: how many megawatt-hours a place will consume in a year. That number is useful, but it is rarely enough. A grid can have plenty of annual energy and still struggle during a few severe hours. A region can reduce total electricity use through efficiency while still raising its winter peak because more buildings use electric heat. A town can add rooftop solar and lower midday net load, then face a steeper evening ramp when the sun fades and people return home.
This is why planners care about load shapes. A load shape describes when electricity is used, not only how much. A flat industrial load, a peaky residential air-conditioning load, a flexible fleet-charging load, and a constant data-center load create different planning problems even if their annual energy use is similar. The energy efficiency and load shape guide makes the same point from the demand side. Efficiency is most valuable when it reduces the work the grid actually has to do, especially during costly or constrained hours.
Load shape also decides which resources are useful. A short evening peak may be well matched to batteries, managed charging, demand response, or thermal storage. A long cold-weather event may require firm capacity, fuel assurance, imports, long-duration storage, or better building envelopes. A summer afternoon peak in a solar-heavy region may look different from a winter morning peak in an electrified heating region. The forecast has to preserve those differences. Averaging them away makes the plan look cleaner than the grid will feel.
Weather Turns Forecasting Into System Planning
Electric demand follows weather because buildings are giant thermal machines. Air conditioners, heat pumps, resistance heaters, chillers, refrigeration, pumps, and ventilation systems respond to outdoor conditions. The relationship is not fixed. It depends on insulation, building size, humidity, appliance efficiency, customer behavior, shade, urban heat islands, and the equipment installed behind the meter. Two regions with the same temperature can have very different electricity peaks if one has gas heating and the other relies heavily on electric heat pumps.
Climate risk makes the task harder without making it unknowable. Planners can study historical weather, stress-test extreme conditions, and ask what happens when many customers respond to the same heat wave or cold snap at once. A forecast that uses only average weather can look reasonable most of the year and fail during the hours that matter most. The grid weatherization and resilience guide covers the equipment and operating side of hard conditions. Load forecasting covers the demand side of the same problem: how much electricity will people need when the weather is least forgiving?
Weather also changes the supply side, which means load forecasts cannot live in isolation. A hot, still evening can raise cooling demand while reducing wind output. A cold snap can raise heating demand while stressing fuel systems and causing equipment failures. Heavy smoke, clouds, or snow can reduce solar production while buildings still need power. The demand forecast and the resource forecast meet in resource adequacy , where planners ask whether the system can serve load during the hardest combinations of demand, outages, renewable output, and network limits.
New Loads Arrive Unevenly
Electrification does not spread across a grid like ink in water. It arrives in clusters. One neighborhood may add heat pumps quickly because contractors, incentives, building age, and customer preferences align. Another may change slowly. A fleet depot may appear on one feeder and add the load of a small town during charging windows. A highway fast-charging site may need a service upgrade even if the county’s annual electricity use barely changes. A factory may replace a fuel-fired process with electric heat and create a new demand block at a single substation.
Data centers make this clustering especially visible. The AI data-center power demand guide explains why computing load is physical infrastructure, not an abstract cloud. For forecasters, a large data-center campus is both easier and harder than ordinary demand. It may have a known developer, a proposed interconnection point, and a relatively steady operating profile. It may also change quickly, arrive in phases, include backup systems, compete for transmission capacity, and depend on cooling design. A regional forecast that treats data centers as a smooth growth rate can miss the local grid work required at the actual node.
EV charging creates a different pattern. Most passenger charging can be flexible if prices, controls, customer trust, and charger settings support it. Fleet depots and fast-charging corridors may be less flexible because vehicles have schedules and drivers need short stops. The EV charging and grid planning guide explains why charging is a planning problem as much as a transportation story. A credible load forecast should distinguish between home charging that can move overnight, depot charging that follows routes, and public fast charging that follows travel behavior.
Industrial electrification adds another layer because factories care about process conditions. The industrial electrification guide describes why process heat is difficult. A load forecast that adds industrial megawatts without understanding temperature, uptime, batch schedules, thermal storage, and grid service limits may overstate flexibility or understate peak demand. The industrial customer may be able to shift some heat production, but it may not be able to pause a furnace because the system peak happens to be expensive.
Flexibility Changes the Forecast
The old habit was to forecast demand and then build supply around it. Future planning has to be more interactive. Some demand is fixed in the moment. Some demand can move. Some can be reduced through efficiency. Some can be buffered with thermal storage, batteries, water tanks, building mass, or process scheduling. That means the forecast is not only a prediction of what customers will do if nothing changes. It can also be a design question: what load shape could exist if programs, rates, controls, equipment standards, and customer protections are built well?
This is where demand response and virtual power plants become forecasting topics. A planner should not count flexibility just because devices are connected. A thermostat, charger, water heater, battery, or industrial control system is useful only when it can respond during the relevant hours, at the relevant location, with customers still willing to participate. Poorly measured flexibility makes the forecast look better than reality. Well-tested flexibility can reduce peaks, defer some upgrades, and make clean resources easier to integrate.
Home electrification shows the same tension at smaller scale. The home electrification and grid flexibility guide covers heat pumps, panels, chargers, batteries, and water heaters. A forecast that assumes every new electric device runs at the worst possible time will overbuild. A forecast that assumes perfect coordination will disappoint. The useful middle ground is evidence: metered behavior, field trials, equipment performance, customer opt-out rates, weather stress tests, and conservative assumptions about what happens when many devices respond together.
Local Forecasts Decide Local Hardware
The bulk power system needs regional demand forecasts, but local grids need feeder and substation forecasts. A regional peak can look manageable while one neighborhood transformer is overloaded. A citywide EV adoption number can hide the fact that charging is concentrated in apartment garages, fleet yards, or affluent single-family neighborhoods. A utility may have enough generation capacity in theory while the local distribution system needs reconductoring, transformer replacement, voltage-control upgrades, or new substation capacity.
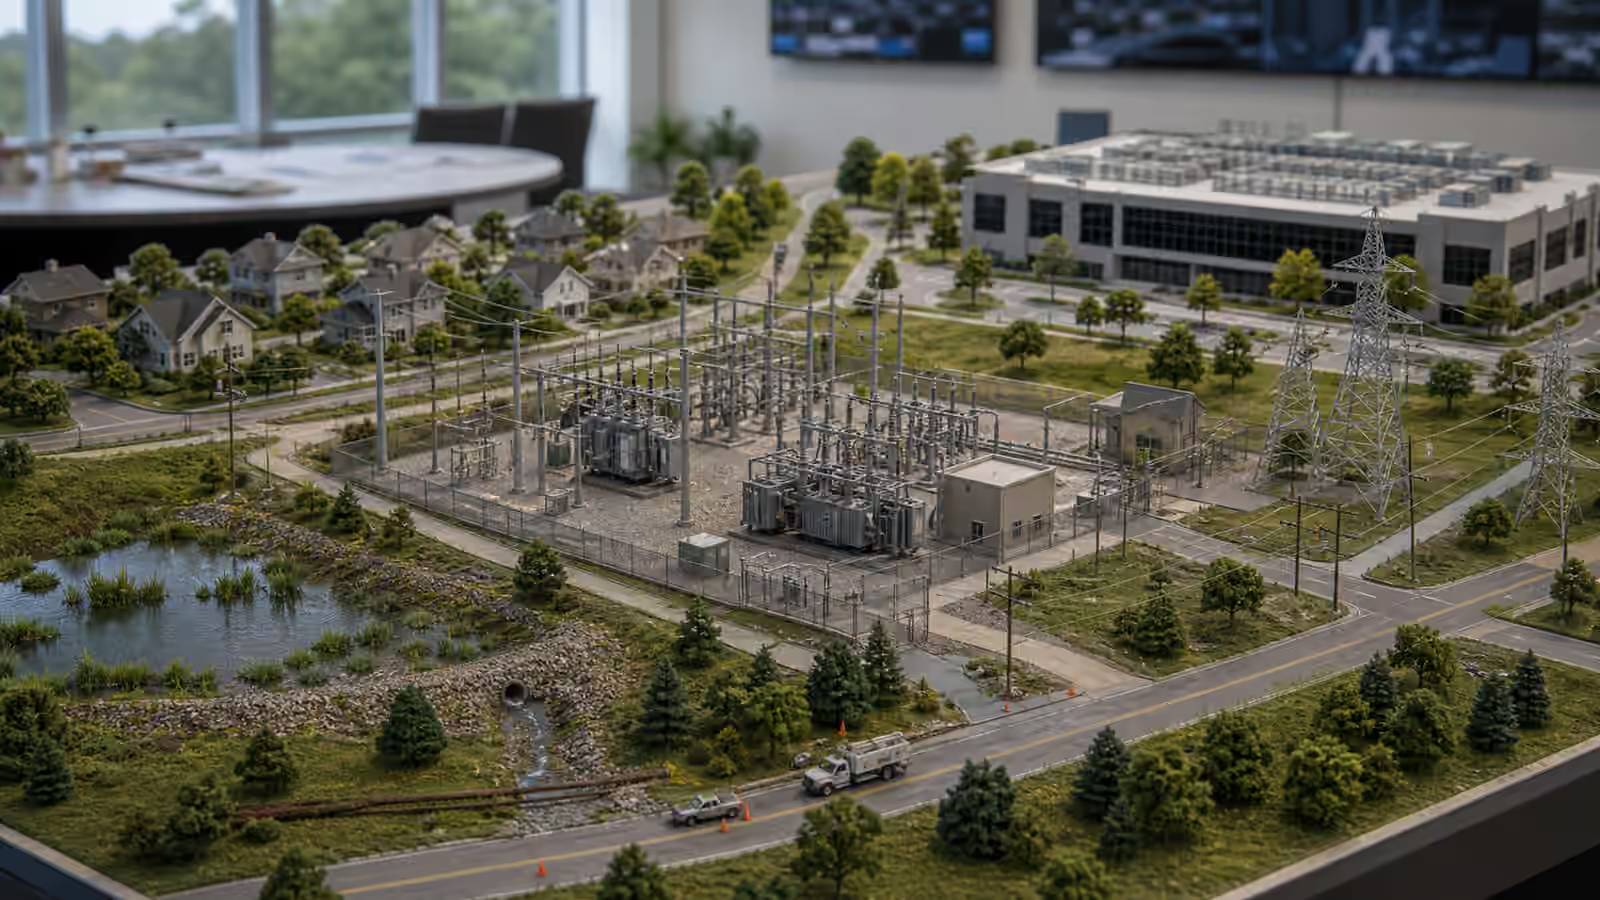
That is why load forecasting belongs next to distribution grid upgrades and transformers and grid hardware . The forecast becomes real when someone orders equipment, schedules crews, requests permits, and coordinates outages. Hardware planning is sensitive to both magnitude and timing. If a transformer is expected to overload for a few hours per year, managed charging or targeted efficiency might help. If a feeder is expected to carry sustained new load from a data center, factory, or electrified district, a larger construction project may be unavoidable.
Transmission planning has the same problem at a larger scale. New load can change the direction and size of power flows. It can make a renewable-rich region look more attractive, or it can worsen congestion if generation and demand grow on opposite sides of a bottleneck. The transmission bottlenecks guide explains why wires are often the limiting system. Load forecasts decide whether those wires look optional, urgent, or already late.
Good Forecasting Is a Discipline
A useful load forecast does not pretend to know the future exactly. It makes assumptions visible. It separates weather effects from economic growth, known large-load requests from speculative development, ordinary customer adoption from policy-driven electrification, and flexible demand from demand that must be served immediately. It uses scenarios because the future is not a single line. It updates as interconnection requests, building permits, charger installations, data-center contracts, appliance sales, and metered behavior change the evidence.
The best forecasts are humble but not vague. They explain what would have to be true for high, middle, and low cases. They show where the grid is sensitive to one customer, one neighborhood, one technology, or one weather pattern. They identify leading indicators so planners can adjust before a shortage appears. They avoid both complacency and panic. A forecast that is always smooth may be hiding local stress. A forecast that treats every announced project as certain may create an expensive mirage.
Forecasting is therefore a trust exercise. Customers, utilities, regulators, developers, communities, and grid operators all live with the consequences. If the assumptions are transparent, people can argue about them productively. If they are buried, the argument moves to the construction project, the rate case, the interconnection delay, or the outage. The forecast is not the whole power plan, but it is one of the first places the plan can become honest.
Powering tomorrow will require new generation, stronger wires, flexible demand, storage, better buildings, careful markets, and credible siting. None of those pieces can be sized well without knowing what load they are being asked to serve. Load forecasting is not a prediction written once and filed away. It is the living measurement of how the electric system is changing, and it deserves the same practical attention as the hardware it eventually justifies.