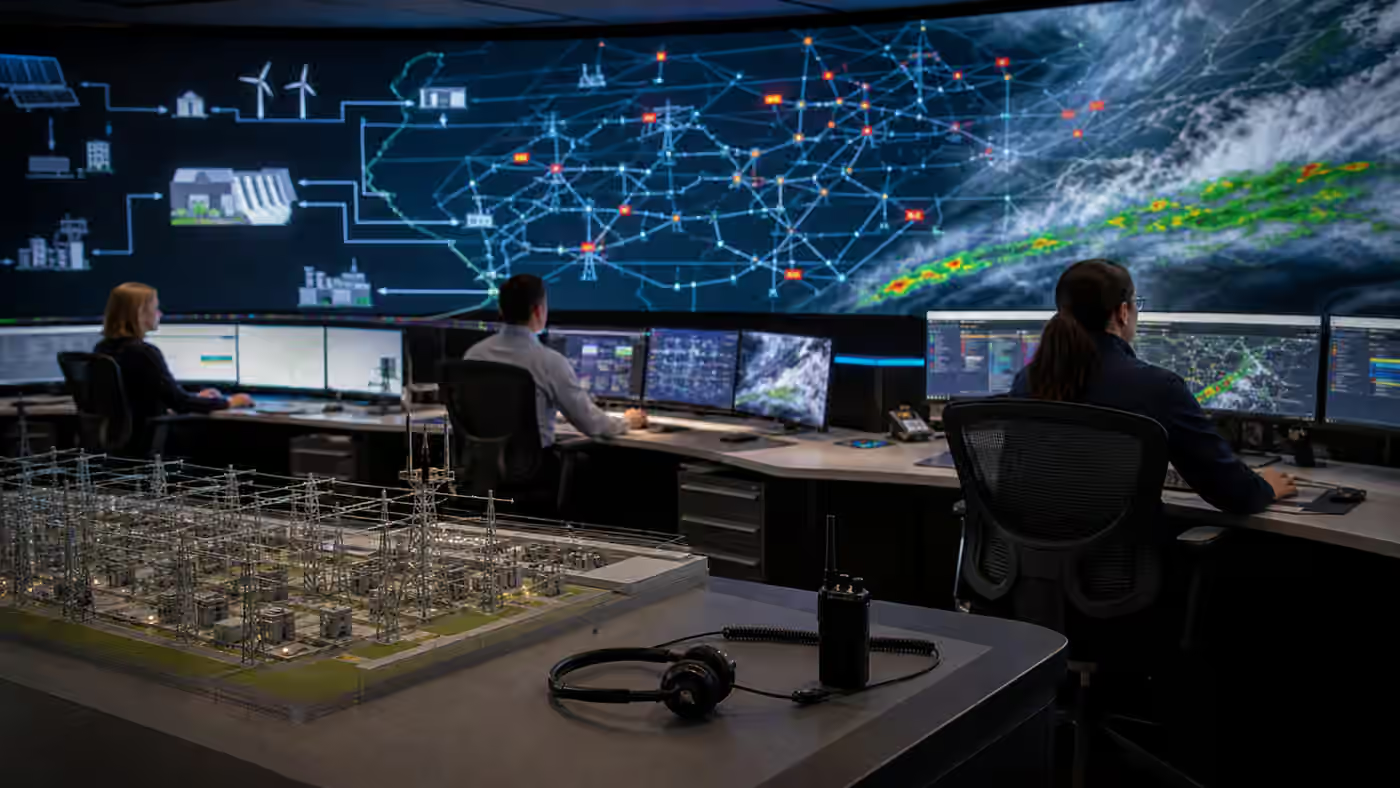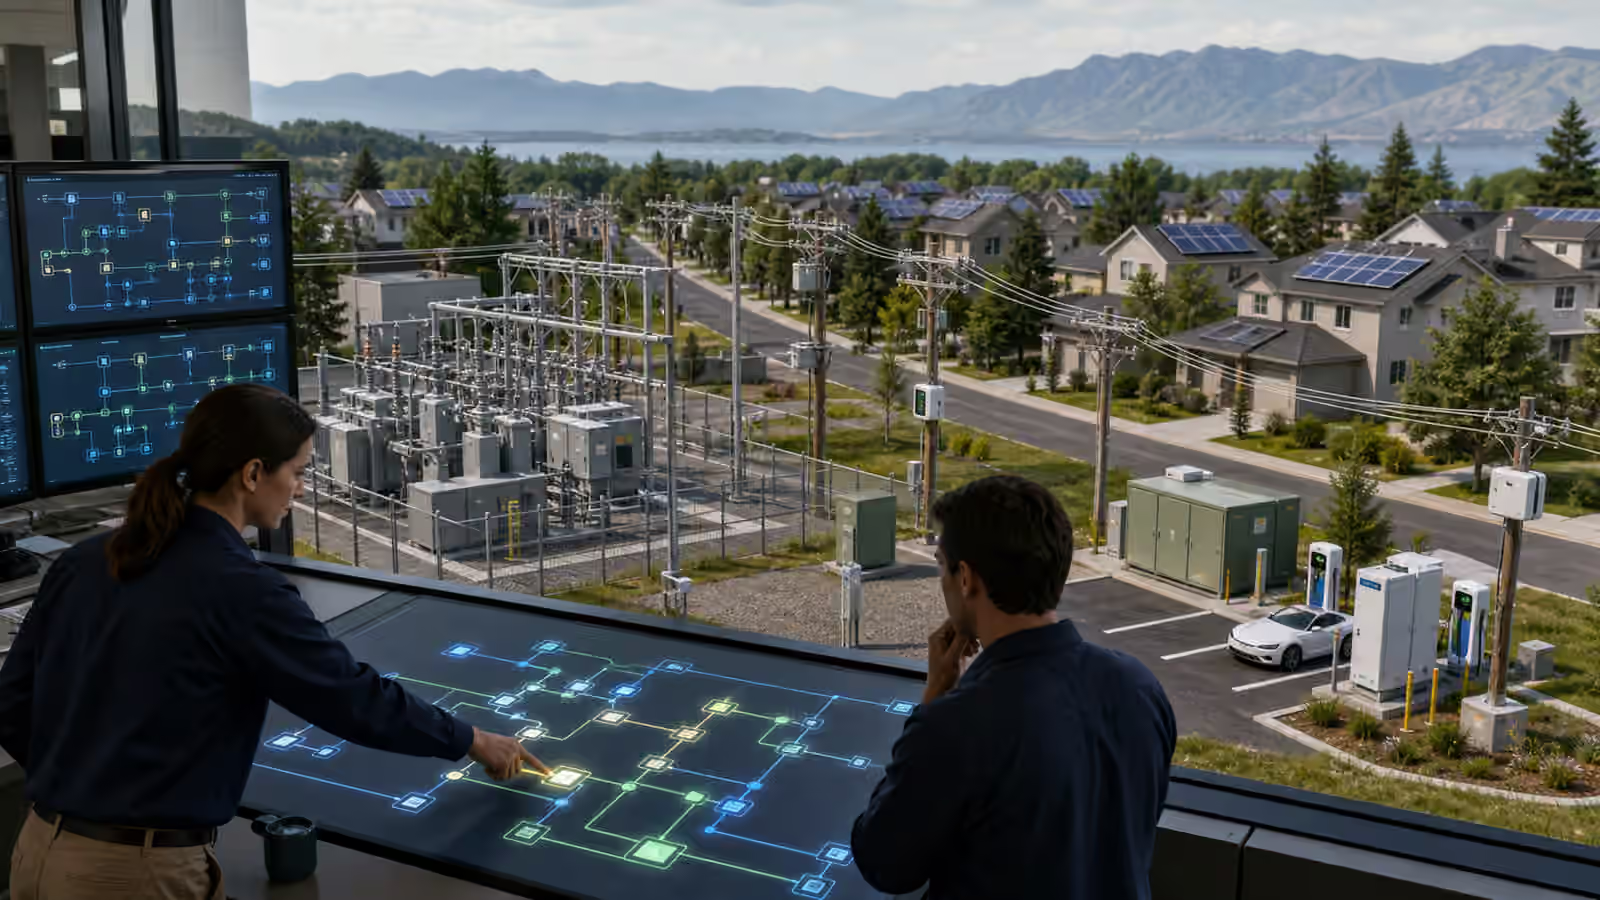

The electric grid cannot be operated well if operators cannot see what it is doing. That sounds obvious, but visibility is not a single camera pointed at the system. It is a layered picture built from substation measurements, power plant telemetry, weather feeds, line ratings, customer load estimates, inverter data, outage reports, equipment alarms, market schedules, and field crew observations. Some signals arrive in seconds. Some arrive in minutes. Some are estimates. Some are wrong until someone checks the device in the field.
As the grid changes, that picture has to become sharper. More wind and solar make weather more important. More batteries and inverters make fast controls more important. More distributed resources make the edge of the grid less passive. More data centers and electrified factories create large loads whose behavior matters to regional operations. More digital controls create more telemetry, but also more noise and more cybersecurity responsibility. Future energy is not only a construction project. It is an observation problem.
The guide to renewable forecasting and grid operations explains how weather and plant telemetry shape operating decisions. Grid visibility is the wider discipline behind that work. It asks whether the control room, planners, protection engineers, field crews, market operators, and distribution teams are looking at a trustworthy enough version of the same machine.
Visibility begins with measurements, but it does not end there
Basic grid measurements include voltage, current, frequency, breaker status, transformer loading, generator output, line flows, and equipment alarms. Supervisory control and data acquisition systems, often called SCADA, collect many of these signals and allow operators to monitor and control parts of the grid. These systems are essential, but they are not a complete picture by themselves. They may update too slowly for some disturbances, miss parts of the distribution system, or depend on devices that fail quietly until a discrepancy appears.
A measurement becomes useful only when it is placed in context. A high loading value on a transformer means different things on a mild morning, during a heat wave, during maintenance, after a neighboring line trips, or while a large customer is ramping up. A voltage alarm may point to a local equipment problem, a wider reactive power issue, or a temporary response to a fault elsewhere. The number matters, but the network around the number matters just as much.
State estimation is one way operators turn measurements into a usable picture. A state estimator compares telemetry with a model of the grid and calculates a consistent view of voltages, flows, and conditions across the network. When measurements conflict, the tool can help identify suspect data. When data is missing, it can estimate values within limits. That does not make the model infallible. It makes the quality of measurements, models, and topology data part of reliability.
Fast signals reveal behavior that slow signals miss
Some grid events unfold faster than ordinary monitoring can explain. A line fault, generator trip, inverter response, frequency dip, oscillation, or voltage collapse can move in fractions of a second. Phasor measurement units and related high-speed sensors help operators and engineers see synchronized electrical behavior across distance. Instead of only knowing that a disturbance happened, they can study how voltage angle, frequency, and oscillations moved through the system.
This matters for a grid with more inverter-based resources. Grid-forming inverters and grid inertia and frequency response both depend on behavior in the first moments after a disturbance. Operators need to know whether resources rode through correctly, whether controls supported the system, whether an oscillation is emerging, and whether a protection setting acted as expected. Slow averages can hide the behavior that decides whether a disturbance remains local.
High-speed visibility also helps after the fact. Engineers can replay an event and learn which devices responded, which models were wrong, and which settings need review. That evidence is valuable because grid reliability often improves through disciplined learning. A near miss that is measured well can prevent a future outage. A near miss that is invisible becomes only a rumor in the control room.
Distribution visibility is becoming more important
The distribution grid was once treated by many systems as a mostly one-way delivery network. Power flowed from substation to feeder to customer. Operators still cared about outages and voltage, but they often had less real-time visibility than on the transmission system. That old assumption is weakening. Rooftop solar, batteries, EV charging, heat pumps, community solar, smart thermostats, backup generators, and flexible loads can all change what happens on local circuits.
Distribution grid upgrades explains the neighborhood layer of future power. Visibility is one of those upgrades. A utility may need better feeder sensors, transformer monitoring, advanced meters, outage management tools, distributed energy resource management systems, and models that reflect how circuits are actually wired. Without that information, planners may overbuild in one place, underbuild in another, or miss a local constraint until customers feel it.
The challenge is not simply installing more devices. Distribution systems contain many assets, many customers, and many privacy expectations. Advanced meters can reveal useful load patterns, but the data has to be handled carefully. Transformer monitors can identify overload risk, but they also add equipment to maintain. Device-level flexibility can help the grid, but it requires enrollment, communications, customer trust, and a clear way to confirm performance. Visibility has to serve operations without turning homes and businesses into careless data sources.
Weather is part of the grid model
Weather has always affected the grid. Heat waves raise cooling load. Cold snaps stress heating systems and fuel supply. Wind can cool conductors or damage lines. Wildfire conditions change operating decisions. Flooding, ice, lightning, and storms create outage risk. A future grid with more weather-dependent generation and more electric heating makes weather data even more central.
Dynamic line ratings show the connection clearly. A transmission line’s safe carrying capacity depends partly on ambient temperature, wind, sunlight, and conductor condition. Static ratings use conservative assumptions. Better weather and sensor data can sometimes show that a line can carry more power safely in a given hour. That can reduce congestion, but only if operators trust the data, understand the limits, and integrate the rating into dispatch and reliability tools.
Weather also affects load forecasts and renewable forecasts. A cloud bank can change solar output. A wind ramp can change supply. A cold evening can synchronize heat-pump demand. A storm can remove transmission paths and raise restoration needs at the same time. The future control room needs weather awareness that is operational, not decorative. A pretty map is not enough. The data has to change decisions before the stress arrives.
Asset health is a form of visibility
Grid visibility is not only about power flows. It is also about the condition of equipment. Transformers, breakers, cables, batteries, inverters, cooling systems, relays, and communications devices all age and fail in specific ways. Monitoring can reveal temperature, dissolved gases in transformer oil, breaker operation counts, battery state, vibration, partial discharge, or abnormal cycling. These signals help maintenance move from guesswork toward risk-aware scheduling.
Transformers and grid hardware explains why heavy equipment can become a bottleneck. Asset telemetry helps utilities protect that equipment. A transformer that is overloaded for a short emergency may be acceptable if operators know its condition and cooling limits. The same loading may be dangerous if the unit is already degraded. A breaker that has operated many times may need maintenance before it fails during the next fault. Visibility turns hidden wear into a planning input.
This does not mean every asset needs a sensor on every surface. Monitoring has cost, complexity, and false alarms. The best asset visibility focuses on equipment where failure would be expensive, dangerous, slow to replace, or operationally confusing. The point is to know enough before the equipment becomes the story.
More data also means more responsibility
A more visible grid is a more digital grid. That creates obligations. Telemetry must be authenticated, time-synchronized, protected, stored, and interpreted. Control systems need segmentation and access discipline. Vendor connections need scrutiny. Bad data can be almost as dangerous as missing data if it drives the wrong action. Grid cybersecurity and digital controls is therefore part of the visibility conversation, not a separate appendix.
Human factors matter too. Operators cannot respond to thousands of raw signals without prioritization. Alarm floods can hide the one event that matters. Dashboards can create false confidence if they simplify too much. Machine learning can help identify patterns, but it has to be tested against reality and explained well enough for operators to use it under pressure. The control room needs clarity, not just volume.
The same applies to planning teams. A rich data set can still lead to poor decisions if the underlying model is stale, the topology is wrong, or the assumptions are not challenged. Good visibility includes feedback from field crews, event reviews, customer reports, and commissioning tests. The grid is physical, so its data discipline has to stay connected to physical inspection and operating experience.
Seeing clearly makes other resources more valuable
Many future-energy tools depend on better visibility. Demand response needs measurement to prove that load actually moved. Virtual power plants need telemetry to coordinate many small devices without pretending they are all identical. Batteries need state-of-charge awareness and dispatch signals. Power quality and voltage support needs measurements that reveal local voltage behavior, harmonics, and reactive power needs. Grid restoration and black start needs enough situational awareness to rebuild the system in safe stages.
The payoff is not data for its own sake. A clearer grid can use existing equipment harder without crossing safety limits. It can spot weak points earlier. It can integrate variable resources with less panic. It can distinguish a local device problem from a system trend. It can learn from disturbances instead of merely surviving them. It can make clean energy, flexible demand, and storage more useful because operators know where and when they are needed.
For a reader, the practical habit is to ask what the grid can actually see. When a utility promises flexibility, can it measure performance? When a line is called constrained, is the rating static or weather-aware? When a battery claims grid support, do operators know its state and response? When a disturbance happens, will engineers have evidence afterward? Future power will be built from steel, copper, silicon, concrete, software, and public trust. It will also be built from the quiet ability to know what is happening before the lights flicker.